> ## Documentation Index
> Fetch the complete documentation index at: https://docs.aichanakya.in/llms.txt
> Use this file to discover all available pages before exploring further.
# Dashboard Overview
> Choose a teaching context and read workload, performance, learner, and chapter signals.
# Dashboard overview
Dashboard answers two questions: **What needs attention today?** and **What should I teach next?**
## Choose the context
 1. Choose an assigned **section**.
2. Choose a **subject** available for that section.
3. Confirm the context before interpreting any metric.
4. Select **Create test** when you are ready to plan an assessment for it.
## Scan the teaching day
1. Choose an assigned **section**.
2. Choose a **subject** available for that section.
3. Confirm the context before interpreting any metric.
4. Select **Create test** when you are ready to plan an assessment for it.
## Scan the teaching day
 The summary cards show class size, class average, pending homework, and pending tests. Counts reflect the selected section and subject; they are not institution-wide totals.
 Use **Upcoming Tests** to confirm scheduled work. An empty state means no upcoming test matches the current context.
## Move from signals to action
Use **Upcoming Tests** to confirm scheduled work. An empty state means no upcoming test matches the current context.
## Move from signals to action
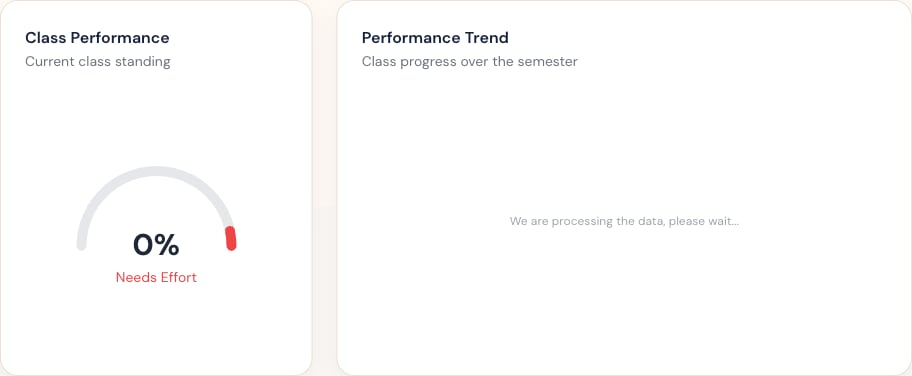
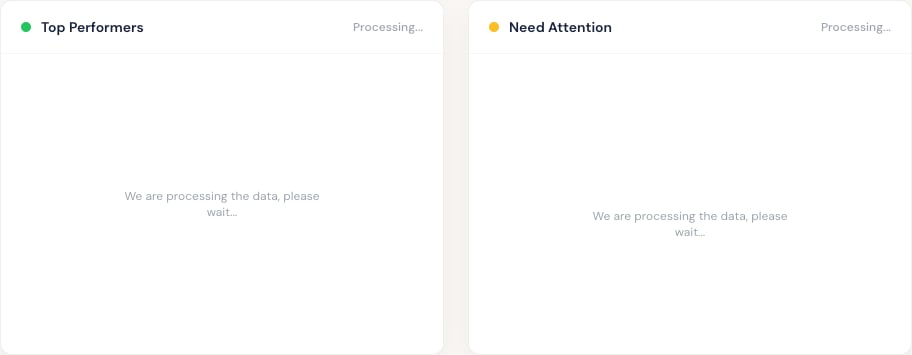
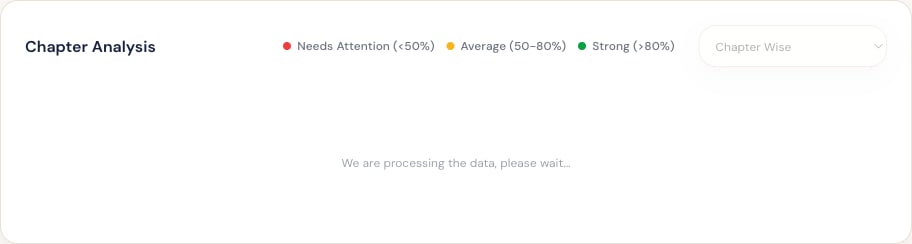 * Use **Class Performance** for the current overall level.
* Use **Performance Trend** to look for change over time, not a single-test conclusion.
* Use **Top Performers** for extension opportunities.
* Use **Need Attention** as a prompt to inspect learner evidence.
* Use **Chapter Analysis** to choose revision priorities.
“Processing” means the insight is not ready. Wait for the data to finish processing before making a conclusion.
## Mobile layout
* Use **Class Performance** for the current overall level.
* Use **Performance Trend** to look for change over time, not a single-test conclusion.
* Use **Top Performers** for extension opportunities.
* Use **Need Attention** as a prompt to inspect learner evidence.
* Use **Chapter Analysis** to choose revision priorities.
“Processing” means the insight is not ready. Wait for the data to finish processing before making a conclusion.
## Mobile layout
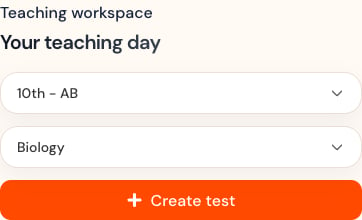
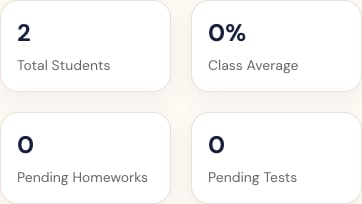 On a phone, open the menu from the top bar. Controls and cards stack vertically; the meaning of the data does not change.
## Related topics
- [Dashboard Overview](/student-guide/dashboard-overview/overview.md)
- [Class Overview & Analytics](/teacher-guide/dashboard-overview/class-overview-and-analytics.md)
- [Teacher Overview Table](/admin-tour-guide/dashboard-overview/overview-tables/teacher-overview-table.md)
- [Student Overview Table](/admin-tour-guide/dashboard-overview/overview-tables/student-overview-table.md)
On a phone, open the menu from the top bar. Controls and cards stack vertically; the meaning of the data does not change.
## Related topics
- [Dashboard Overview](/student-guide/dashboard-overview/overview.md)
- [Class Overview & Analytics](/teacher-guide/dashboard-overview/class-overview-and-analytics.md)
- [Teacher Overview Table](/admin-tour-guide/dashboard-overview/overview-tables/teacher-overview-table.md)
- [Student Overview Table](/admin-tour-guide/dashboard-overview/overview-tables/student-overview-table.md)