Dashboard overview

Dashboard answers two questions: What needs attention today? and What should I teach next?

Choose the context

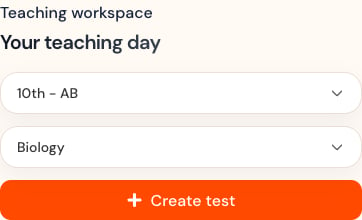
Teacher Dashboard controls for section, subject, and Create test.
  1. Choose an assigned section.
  2. Choose a subject available for that section.
  3. Confirm the context before interpreting any metric.
  4. Select Create test when you are ready to plan an assessment for it.

Scan the teaching day

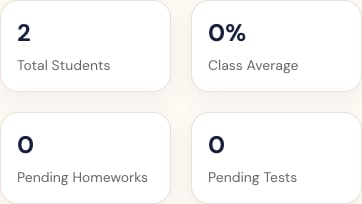
Teacher Dashboard cards for total students, class average, pending homework, and pending tests. The summary cards show class size, class average, pending homework, and pending tests. Counts reflect the selected section and subject; they are not institution-wide totals. Upcoming Tests panel with an empty state and Create test action. Use Upcoming Tests to confirm scheduled work. An empty state means no upcoming test matches the current context.

Move from signals to action

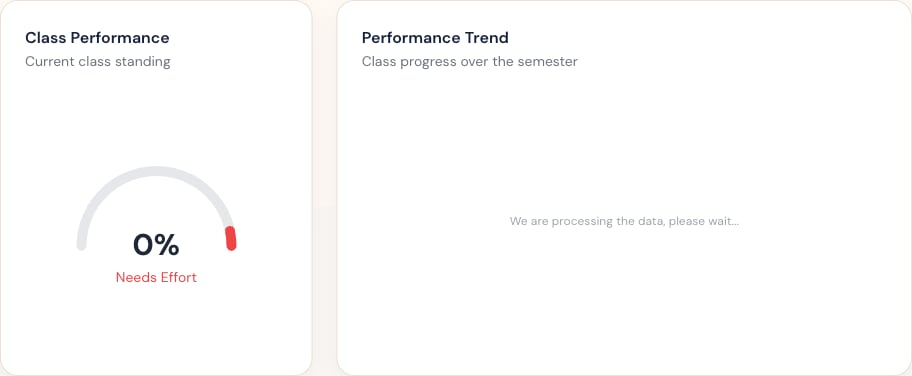
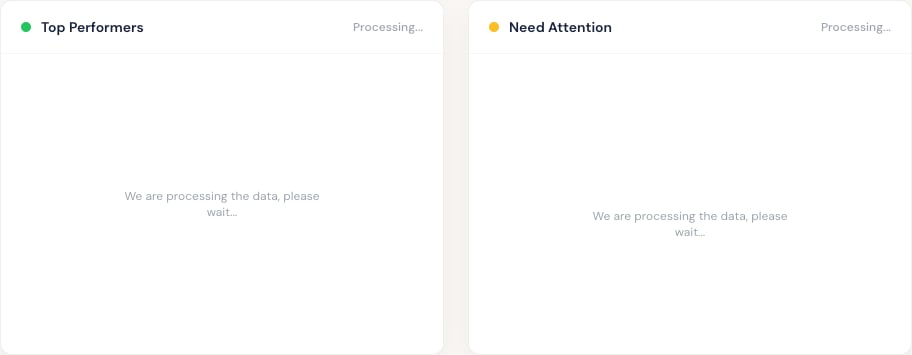
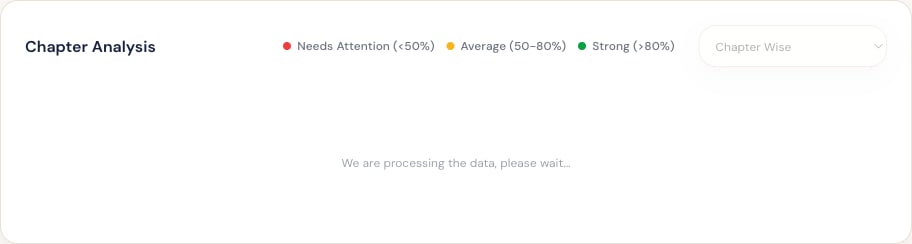
Class Performance and Performance Trend panels on the Teacher Dashboard. Top Performers and Need Attention panels in a processing state. Chapter Analysis with performance bands and sorting control.
  • Use Class Performance for the current overall level.
  • Use Performance Trend to look for change over time, not a single-test conclusion.
  • Use Top Performers for extension opportunities.
  • Use Need Attention as a prompt to inspect learner evidence.
  • Use Chapter Analysis to choose revision priorities.
“Processing” means the insight is not ready. Wait for the data to finish processing before making a conclusion.

Mobile layout

Responsive Teacher Dashboard controls on a mobile viewport. Responsive Teacher Dashboard summary cards on mobile. On a phone, open the menu from the top bar. Controls and cards stack vertically; the meaning of the data does not change.
Last modified on July 29, 2026